
Why Your IT Projects Keep Missing the Mark — And the 2-Step Fix Every Analyst Should Know
Learn the proven two-step method that bridges the gap between business goals and technical delivery—used by top analysts to drive real results.

At some point in your career, you’ll likely face a project that doesn’t go as planned. And as a business analyst, you’ll probably find yourself caught in the middle—frustrated stakeholders on one side, puzzled developers on the other.
Everyone’s asking the same question: “How did we get this wrong when we followed the specs?”
In today’s fast-paced business environment, nearly 70% of IT projects encounter major challenges—even when detailed requirements documents are in place.
The root cause isn’t usually technical complexity—it’s a communication breakdown. So how do you fix that?
The solution lies in two powerful practices: clear process visualization and structured requirements decomposition.
If these terms already sound familiar, you’re on the right path. If not, now’s the perfect time to dive in. In the sections that follow, we’ll unpack each concept and explore how, together, they can dramatically improve your project’s clarity, alignment, and overall success.
Step 1: Business Process Visualization
The first step toward project success is creating a clear and accurate process diagram.
For business analysts, sequence diagrams are especially powerful—they don’t just capture process flows; they bring clarity to complexity. In today’s environment, business analysis is no longer just about documentation. It’s about delivering visual clarity that brings everyone—stakeholders and developers alike—onto the same page.
Effective visualization does the following:
Creates a shared mental model across business and technical teams
Transforms abstract concepts into tangible workflows
Exposes hidden assumptions and dependencies before they become costly issues
Enables "visual validation" where stakeholders can immediately spot misalignments
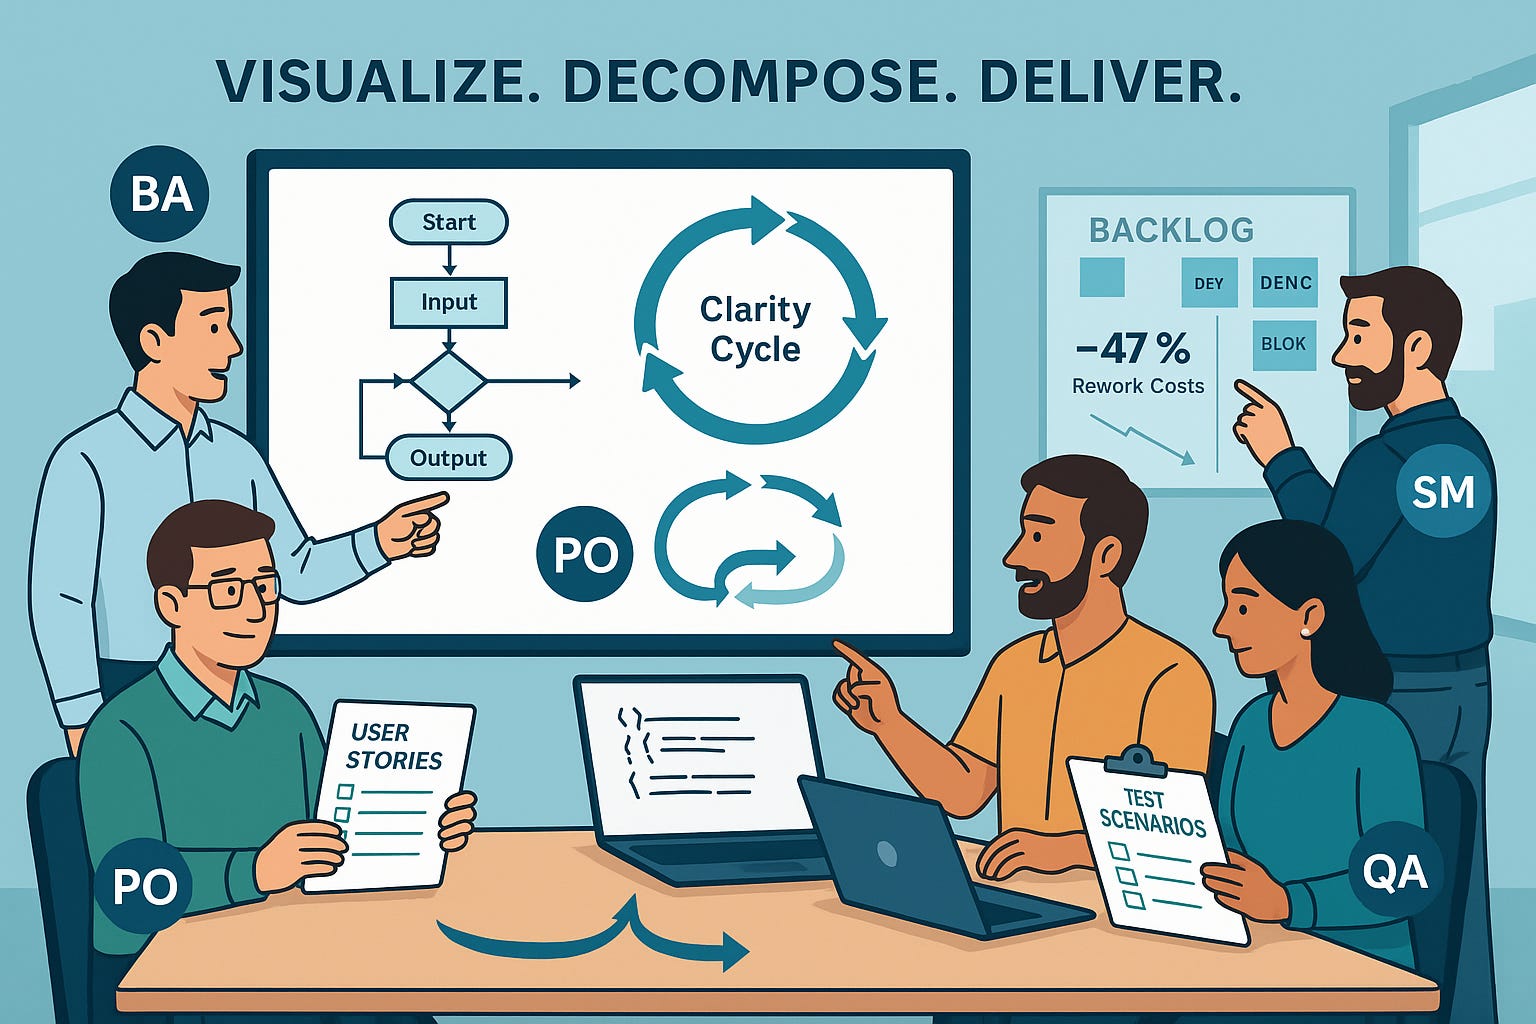
"When we implemented visual process mapping as a requirement for all projects over $250K, our rework costs dropped by 47% in the first quarter alone."
— Sarah Chen, Director of Business Analysis, Financial Services Industry
Step 2: Systematic Decomposition into User Stories
The visualization creates the foundation, but decomposition creates the actionable roadmap:
Each process element transforms into discrete, measurable deliverables
User stories maintain clear traceability to business objectives
Acceptance criteria define precise boundaries, preventing scope creep
Cross-functional dependencies become visible and manageable
The magic happens when these approaches work in tandem, creating what we call the "Clarity Cycle" – where visualization informs decomposition, and decomposition refines visualization.
This structured two-step approach provides measurable benefits across all roles involved in driving successful change.
Here's how each role gains value from its implementation.
🔹 Role Product Owner
Visualization Benefits: Overall process overview; Materials for stakeholders; Risk identification
Decomposition Benefits: More accurate estimates; Easier prioritization; Measurable progress
🔹 Role Developers
Visualization Benefits: Quick understanding of context; Overview of dependencies; Technical connections
Decomposition Benefits: Clear functionality boundaries; Fewer conflicts in code reviews; Better time estimates
🔹 Role Testers
Visualization Benefits: Complete test scenarios; Identification of edge cases; Overview of integrations
Decomposition Benefits: Structured test plans; Foundation for automation; More efficient bug reporting
🔹 Role Scrum Master
Visualization Benefits: Materials for planning; Identification of blockers; Facilitation of discussions
Decomposition Benefits: Velocity tracking; Dependency management; More efficient stand-ups
Case Study: Payment Gateway Implementation
The following example illustrates how visualization and decomposition work together effectively in a real-world project: implementing a payment gateway within an e-commerce system.

Ready to Get Started? Here’s How to Begin
If this approach resonates with you, your next question is likely: “How do we put this into practice?” We recommend starting with a focused, practical roadmap:
Implementation Blueprint: Turning Concept into Action
Start with a pilot project
Choose a moderately complex initiative with active, engaged stakeholders to test and refine the approach.Build your visualization toolkit
Identify and standardize 3–5 diagram types that align well with your team’s communication style and project needs.Define decomposition standards
Establish clear guidelines for breaking down processes and requirements to the right level of detail for your environment.Implement end-to-end traceability
Link every user story directly to visualization elements and business objectives to maintain alignment and accountability.Track baseline and outcomes
Measure key performance indicators before and after implementation to evaluate impact and guide continuous improvement.

In today’s digital landscape, business analysts are no longer just requirement gatherers—they are strategic enablers who drive clarity and execution through visualization and decomposition.